Hi I seem to be having HTTP/2 HTTPS benchmark performance issues with h2load HTTP/2 HTTPS load tester from nghttp2 library. It definitely seems like a bug to me.
Background
I setup a CentOS 7.5 64bit 1GB, 1 cpu KVM VPS on upcloud and installed Cyberpanel via command
yum -y update; reboot;
time sh <(curl https://cyberpanel.net/install.sh || wget -O - https://cyberpanel.net/install.sh)
`
Then I created a HTTPS web site and installed wordpress + lscache with the native cyberpanel installer with letsencrypt ssl certificate
Then I installed OceanWP theme and demo installer plugins to install Coach OceanWP theme https://coach.oceanwp.org/
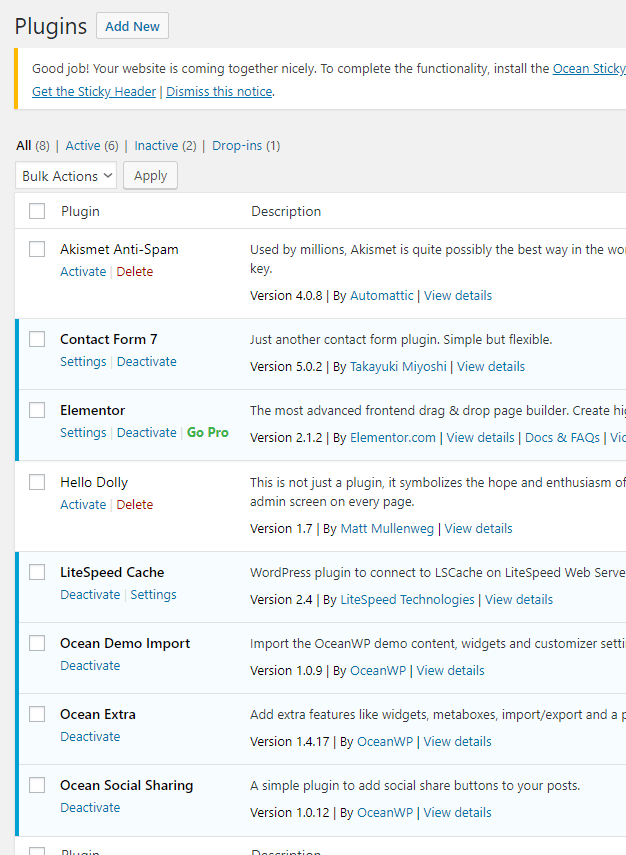
Attached is wp plugin list
h2load HTTP/2 HTTPS benchmarks
h2load HTTP/2 HTTPS load testing tool is source installed
installed as follows
yum -y install libevent libevent-devel libev libev-devel zlib-devel libxml2 libxml2-devel
yum -y install libevent libevent-devel jansson-devel jemalloc-devel c-ares c-ares-devel autoconf automake libtool git;
mkdir -p /svr-setup;
cd /svr-setup;
git clone --depth=1 https://github.com/nghttp2/nghttp2;
cd nghttp2;
git submodule update --init;
autoreconf -i;
automake;
autoconf;
./configure --enable-app;
make -j$(nproc);
make install;
`
h2load version
h2load --version
h2load nghttp2/1.33.0-DEV`
then to test using h2load HTTP/2 HTTPS load tester simple 1 user and 1 request first
domain=https://domain.com
h2load -t1 -H 'Accept-Encoding: gzip' -c1 -n1 $domain
`
result note the finished in line results
h2load -t1 -H 'Accept-Encoding: gzip' -c1 -n1 $domain
starting benchmark...
spawning thread #0: 1 total client(s). 1 total requests
TLS Protocol: TLSv1.2
Cipher: ECDHE-RSA-AES128-GCM-SHA256
Server Temp Key: ECDH P-256 256 bits
Application protocol: h2
progress: 100% done
finished in 223.38ms, 4.48 req/s, 49.09KB/s
requests: 1 total, 1 started, 1 done, 1 succeeded, 0 failed, 0 errored, 0 timeout
status codes: 1 2xx, 0 3xx, 0 4xx, 0 5xx
traffic: 10.97KB (11229) total, 359B (359) headers (space savings 26.88%), 10.51KB (10767) data
min max mean sd +/- sd
time for request: 220.45ms 220.45ms 220.45ms 0us 100.00%
time for connect: 2.50ms 2.50ms 2.50ms 0us 100.00%
time to 1st byte: 222.98ms 222.98ms 222.98ms 0us 100.00%
req/s : 4.48 4.48 4.48 0.00 100.00%
`
then to test higher concurrency using h2load HTTP/2 HTTPS load tester = 100 user and 1000 request
domain=https://domain.com
h2load -t1 -H 'Accept-Encoding: gzip' -c100 -n1000 $domain
`
result note the finished in line results - it's extremely slow with failed requests and definitely a bug it seems ?
h2load -t1 -H 'Accept-Encoding: gzip' -c100 -n1000 $domain
starting benchmark...
spawning thread #0: 100 total client(s). 1000 total requests
TLS Protocol: TLSv1.2
Cipher: ECDHE-RSA-AES128-GCM-SHA256
Server Temp Key: ECDH P-256 256 bits
Application protocol: h2
progress: 10% done
progress: 20% done
progress: 30% done
progress: 40% done
progress: 50% done
progress: 60% done
progress: 70% done
Process Request Failure:2
progress: 80% done
progress: 90% done
finished in 209.70s, 4.76 req/s, 54.16KB/s
requests: 1000 total, 998 started, 998 done, 998 succeeded, 2 failed, 2 errored, 0 timeout
status codes: 998 2xx, 0 3xx, 0 4xx, 0 5xx
traffic: 11.09MB (11630932) total, 66.60KB (68202) headers (space savings 86.07%), 10.97MB (11502850) data
min max mean sd +/- sd
time for request: 2.19s 21.96s 20.01s 3.37s 92.99%
time for connect: 166.44ms 179.28ms 171.83ms 3.99ms 64.00%
time to 1st byte: 2.36s 21.31s 11.87s 6.06s 60.00%
req/s : 0.05 0.05 0.05 0.00 60.00%
`
also used forked wrk version, wrk-cmm for HTTP/1.1 HTTPS tests
domain=https://domain.com
cd /svr-setup/wrk-cmm
wrk-cmm -t1 -c100 -d10s --breakout -H 'Accept-Encoding: gzip' --latency $domain
`
results
wrk-cmm -t1 -c100 -d10s --breakout -H 'Accept-Encoding: gzip' --latency $domain
Running 10s test @ https://domain.com/
1 threads and 100 connections
unable to record first byte metrics
unable to record first byte metrics
unable to record first byte metrics
unable to record first byte metrics
unable to record first byte metrics
unable to record first byte metrics
unable to record first byte metrics
unable to record first byte metrics
unable to record first byte metrics
unable to record first byte metrics
unable to record first byte metrics
unable to record first byte metrics
unable to record first byte metrics
unable to record first byte metrics
unable to record first byte metrics
unable to record first byte metrics
unable to record first byte metrics
unable to record first byte metrics
unable to record first byte metrics
unable to record first byte metrics
unable to record first byte metrics
unable to record first byte metrics
unable to record first byte metrics
unable to record first byte metrics
unable to record first byte metrics
unable to record first byte metrics
unable to record first byte metrics
unable to record first byte metrics
unable to record first byte metrics
unable to record first byte metrics
unable to record first byte metrics
unable to record first byte metrics
unable to record first byte metrics
unable to record first byte metrics
unable to record first byte metrics
unable to record first byte metrics
unable to record first byte metrics
unable to record first byte metrics
unable to record first byte metrics
unable to record first byte metrics
Thread Stats Avg Stdev Max +/- Stdev
Latency 0.00us 0.00us 0.00us -nan%
Connect 231.21ms 9.11ms 244.35ms 67.00%
TTFB 0.00us 0.00us 0.00us -nan%
TTLB 85.20us 34.96us 166.00us 77.50%
Req/Sec 17.44 28.10 90.00 88.89%
Latency Distribution
50% 0.00us
75% 0.00us
90% 0.00us
99% 0.00us
40 requests in 10.07s, 445.23KB read
Socket errors: connect 0, read 0, write 0, timeout 40
Requests/sec: 3.97
Transfer/sec: 44.22KB
`